In this case I'm going to use an LS-4000 scanner, but I use exactly this technique with Epson flatbed scanners too.
To make this 'tutorial' as generic as possible I'll skip the detailed bits on the scanner operation, but I've covered those aspects in other posts on this blog here and here.
No matter what the driver, leave the system believing that it is scanning a positive, not a negative. Then, carefully tweak the red green and blue channels by bringing the sliders (particularly on the light end) closer to the main humps of the datain the histogram ... but don't set the level too close to the data ... you'll clip details if you're not careful. If in doubt test and inspect for high light clipping.
Ok ... now you've scanned it into your editor ... I use photoshop, so I'm sorry you'll have to 'translate' this to what ever makes the right stuff for your editor.
start - its now in your editor
my scanner is set to produce its data in a colour profile of Bruce RGB, so your next step is to assign that profile (unless your scanner is set in its configuration to produce data of another profile check your scanner configuration). Now if your editor does not handle colour management then I guess you'll have to find a way to have your scanner put data out in sRGB ... but I'd really advise you to get a better editor.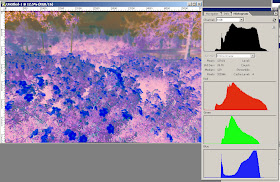
You'll see an immediate change on the way stuff looks straight away ...
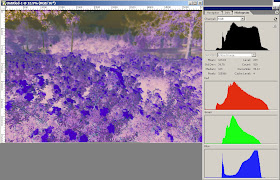
so now we do the next step, which is invert
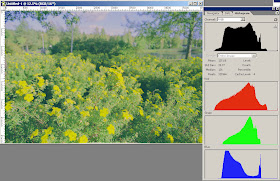
starting to look right now isn't it ... so much for all that "orange mask" stuff ...
So now we need to sort out the levels more carefully. I deliberately left 'breathing room' before so that we can see more carefully where our levels are in a system which is more amenable to it.
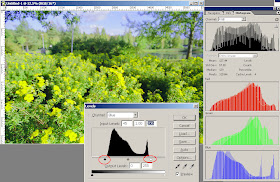
notice how I've moved the levels closer to the humps of the histogram. If you can, hold down the Ctl key which will let you know where clipping is occurring visually. When you get to clipping, back off a little ... because we'll get it closer in the next step with curves.
here I apply a little curve adjustment ... I normally need to pull up the light and pull down the dark areas ... this helps a little to reduce noise, as this represents the indistinct areas near the film base and the areas where the film is approaching saturation (totally black).
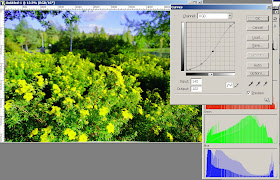
So now we have the image within ball park. From here you can "go wild and do your worst"
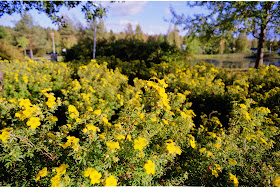
I've also done a little local area contrast fix here too
Anyway, assuming this was helpful, you might find these quick notes interesting too:
- another Nikon example
- a more detailed examination of scanning Neg as Positive here
- using the Epson for bulk scanning of 35mm colour neg (and getting your desired settings applied across all evenly)
- registration problems on Epson scanners and why you shouldn't go too far in trying to adjust this or that because when you improve focus you may disturb registration
- using your scanner to understand film density.
- driving your scanner software differently to effect some changes in scanner side exposure on Epsons (meaning better noise characteristics in the dense areas of your negs).
- don't forget colour management on your Epson (its not where you might think it is)
- Black and White neg scanning
sorry its not compiled into a single resource, that's my next project
Hope that helps
:-)
PS ... to answer the question below (if I've understood it right) I need to cater for the fact that unlike slide the R G and B levels of density recorded in Negative film is not even ... below is a sample of the 'curve' for a typical negative film.

please have a further read on my other page here.
PPS
to answer the question below in more detail I thought I would try this. Consider a point on the graph (not a range) the values for this colour below are 808040 in RGB values This is of course a pure tone and has not "variation" or range.
 Now if you were to represent this on negative film the values would not simply be negative, they would also be scaled according to that graph above.
Similarly if I was to take a plain grey tone and photograph it with negative film I will not be able to read values 808080 or even simply inverted values as the response of the film to the light will give different density readings for each of R G and B ... this is unlike positive film (slide film) which does give such (eventually)

Hi,
ReplyDeleteThanks for the tutorial. I'm curious... Is there a particular reason for scanning and leveling the "negative"?
Hello, I've found your tutorial very useful, however it doesn't work with new Ektar. This workflow works great with other negatives (I've tried Kodak Gold and Portra 160NC), but Ektar needs another approach (unfortunatelly I do not figured it out yet).
ReplyDeleteNow, I have a question for you. The density _ranges_ for R, G and B on the characteristics curve are more less the same for each of the colors (the lines are parallel). So, how come the histograms of scanned negative have different width for R, G, and B?
JaZ
ReplyDeletethanks for the feedback on the Ektar ... I'll have to look into that. Any chance you could either send me something of your results or perhaps a strip of film for analysis? Please feel free to communicate by pellicle at hotmail
To answer your question pick any exposure amount on the graph (say zero) and trace up the Y axis to read off the density. You will see that (for zero) you get density of something like R=0.75 G=1.25 and B=1.5 thus for equal colour balance (NB something which is neutral grey) you need to scale the density to reflect that neutrality RGB of grey would be something like RGB = 128, 128, 128
Hello, my question was different. Let's take a picture which consists of two rectangles only: white and black, and let's pretend we are using the curves you have posted. So, the white rectangle requires exposure of value 1 on the chart, the black rectangle requires exposure of value -2.5. Now, let's calculate the density deltas for earch layer:
ReplyDeletedR=1.75-0.25=1.5
dG=2.25-0.75=1.5
dB=2.6-1.1=1.5
As you see, the density range is the same for each layer. So, after scanning the histograms should have a very similar widths.
Either I'm missing something importand, or the characteristic curves the manufacturer produces are bogus one.
JaZ
Jaz they have similar widths but different density ... The charts are not bogus, go grab one from Kodak or fuji yourself. Heck you even see it when you scan a negative as well as in the different density values above.
ReplyDeleteI don't know how to explain this more carefully to you, look at the charts, compare the values (values not ranges) obtained at each exposure value and see that to get grey to be grey they must be repositioned.
That each of the layres are linear in responce to light in a range is a necessary design parameter to reproduce the colour in a meaningful way.
Jaz they have similar widths but different density ...
ReplyDeleteAgree. This is caused by the orange mask.
The charts are not bogus, go grab one from Kodak or fuji yourself.
There is misunderstanding. What I said is that the manufacturer produces bogus charts, not you. ;)
I don't know how to explain this more carefully to you, look at the charts, compare the values (values not ranges) obtained at each exposure value and see that to get grey to be grey they must be repositioned.
Sure thing. However, if I scan the negative as positive in linear 16-bit mode (HDR in Silverfast) I expect that the range of RGB values will be the same (the scanner response to the density should be more or less linear in HDR mode). If so, removing the orange mask should be as easy as substracting constant values from RGB data. But it is not a case since B and G histograms are narrower than R one. So, removing orange mask requires not only to shift histograms to the left (to get black instead of orange), but also to extend G and B channels to match the width of R channel, so the white will be the white (if there is the white on the image).
The only thing I do not understand is how come the same density ranges don't produce the same RGB ranges on the linear scan.
On Ektar: If you take a look into the characteristic curve you will see that the B curve is not parallel to the G and R, so I think it could be one of the reason of the scanning problems.
Jaz
ReplyDeleteI was thinking you meant the manufacturers not me doctoring the charts. The one I linked to was from Fuji, I encouraged you to examine others. They are not wrong. What I have written is perhaps the simplest explanation of this you'll find anywhere. To the best of my knowledge I stand by its accuracy (even if I admit it may gloss over complexity)
I recommend you read this thread on orange masks if you have interest (http://www.apug.org/forums/forum40/57928-c-41-colour-film-orange-mask.html) but it is one of the most misunderstood issues in colour negative work. Essentially you can ignore that it exists and follow the methods I outlined above.
By introducing other software such as silverfast you complicate the reality of simple densitometry. At the end of the day what I see on my scanner in linear mode matches what the makers publish and that is a significant positive.
As I said earlier, I would be interested to explore the issue you are having with Ektar and suspect that it is a HUE related issue (caused by the frequency of light your / my / our scanner uses and the actual frequency of attenuation of the dye) I believe that a quick tweak of red / yellow channel or blue / cyan channels in photoshop as your last step will fix this easilly and consistently across this film and your scanner
JaZ
ReplyDeletein case I've been sounding cranky I'm not feeling it, so please don't interpret my "tone" in ascii as meaning anything except the subject. NB don't read between the lines on this one ;-)
There is no problem, really ;)
ReplyDeleteThanks for link to the discussion, I hope I will have a time to study this subject in more details.
Regarding Silverfast - I'm using it only in the linear HDR mode. No fancy color profiles for negative film -- there is no need to use it. So, I'm not complicating anything ;)
Regarding characteristic curves -- I have a strong feeling that manufactures do something strange and the color characteristic curves are not the same kind of animal as B&W ones. I hope I will make time to prepare the D-H curves by myself.
Regarding Ektar - I've sent you an email with 6MB attachment - I hope you have received it.
JaZ