
its been a pretty busy year with house removations, and then sales, and then moving to Finland all bundled into September, October. I've re-settled into life in Finland (as you'll see in earlier posts) and have been getting into cross country skiing and training most days.
As always the graph axes are INR (LHS) , dose (in mg per day on RHS) and the scale being the numbers of the week. There is a -1 and 0 because I provide a context from the previous year.
The usual seemingly cyclic ups and downs and a little "guidance" needed in the first 3/4's of the year. But despite a bit of a bumpy ride (for the dose line, for me I was fine) I managed to keep my stats looking good. For my own purposes I calculate an INR OVER event as INR > 3.2 and an UNDER event as < 2 So with that counting arrangement I was in range 94% of the time, a pretty good result by anyone's standards (and better than many clinics).
| average | 2.6 |
| std dev | 0.4 |
| max | 3.5 |
| min | 2.0 |
| over event | 3 |
| under event | 0 |
| inRange % | 94.6 |
I did notice that the last few weeks has shown a much reduced variance in INR which seems to coincide with being in Finland. I can't think of much else to clarify it as I drink about the same amount of beer per day and eat pretty much the same ... dunno. Either way my approach takes all these variations in stride and I'm pretty sure that if I was being managed (or should that be mis-managed) by a clinic (testing bi-weekly or worse) I'd be all over the joint and perhaps have been injured by it.
My range of 2 ~ 3 as mentioned above is even a bit conservative when dealing with the high end as the literature shows that I can go higher into the 4's without stressing about bleed even risk much.
(detailed article here)
However I've found that INR > 3 makes brusing more annoying (and I was using hammer and power tools a lot till just recently) and so I keep it a bit tighter than is perhaps essential for good health.
Basically its all been good, and my regime of weekly checking and my strategy of dealing with dose changes is working well.
Happy New Year to you all
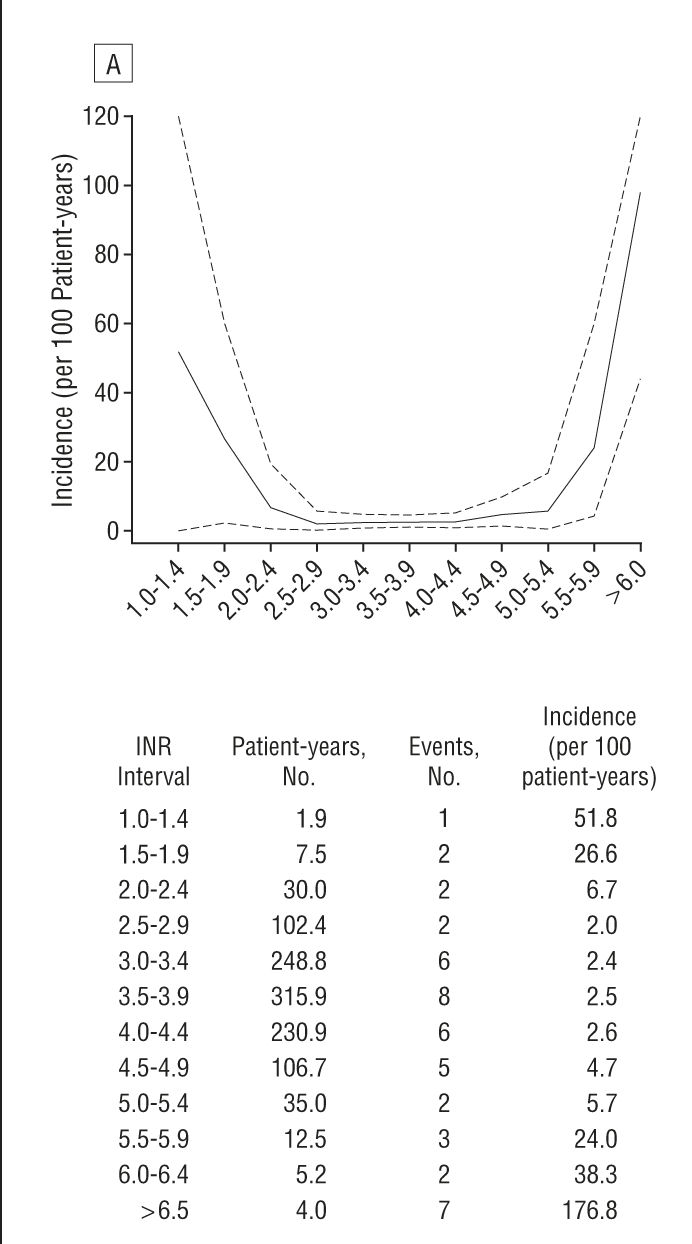
PS as some people may not be good at reading graphs I thought I'd take a moment to assist in walking through the above two graphs and explaining a little. Firstly the INR vs Incident graph above shows its safest point when the INR is between 2 and 4.5
One can see that reading my INR graph that my INR was between 2 and 3 almost all of the time. Lets clarify that with just looking at the INR plot per week:

so, lets grab that graph (which has INR on its Y axis and put that over the graph that has safety vs INR with INR over the X axis

so you can see clearly that my INR range has not strayed into the "risky areas" at all.
:-)


No comments:
Post a Comment